The Caregiver Profile
Who are these caregivers and what do they help with? Learn about their life and caregiving situation.

A total of 30 caregivers participated in this study. Who are these people? What are they providing care for? Learn more about these employed family caregivers and their life.
About the Caregivers

Caregiver age and gender
50% of participating caregivers were aged 48 to 57. The youngest caregiver in the study was 35, and the oldest was 63. The first quartile age was 47.75, the median age was 53, and the third quartile age was 57.
90% of participating caregivers were female, while only 10% were male.
Income and employment
13% of participating caregivers were employed part-time, while the remaining 87% were employed full-time.
| Number of caregivers | Income |
|---|---|
| 7 | less than $50,000 |
| 9 | between $50,000 and $75,000 |
| 3 | between $75,000 and $100,000 |
| 7 | between $100,000 and $150,000 |
| 4 | $150,000 or more. |
Marital status and household
17 participating caregivers are married or living with a partner.
7 caregivers are single, never married.
6 caregivers are divorced or separated.
On average, caregivers live with 1.5 other people.
20% of caregivers live with kids.
The Caregiving Situation

Care recipient condition
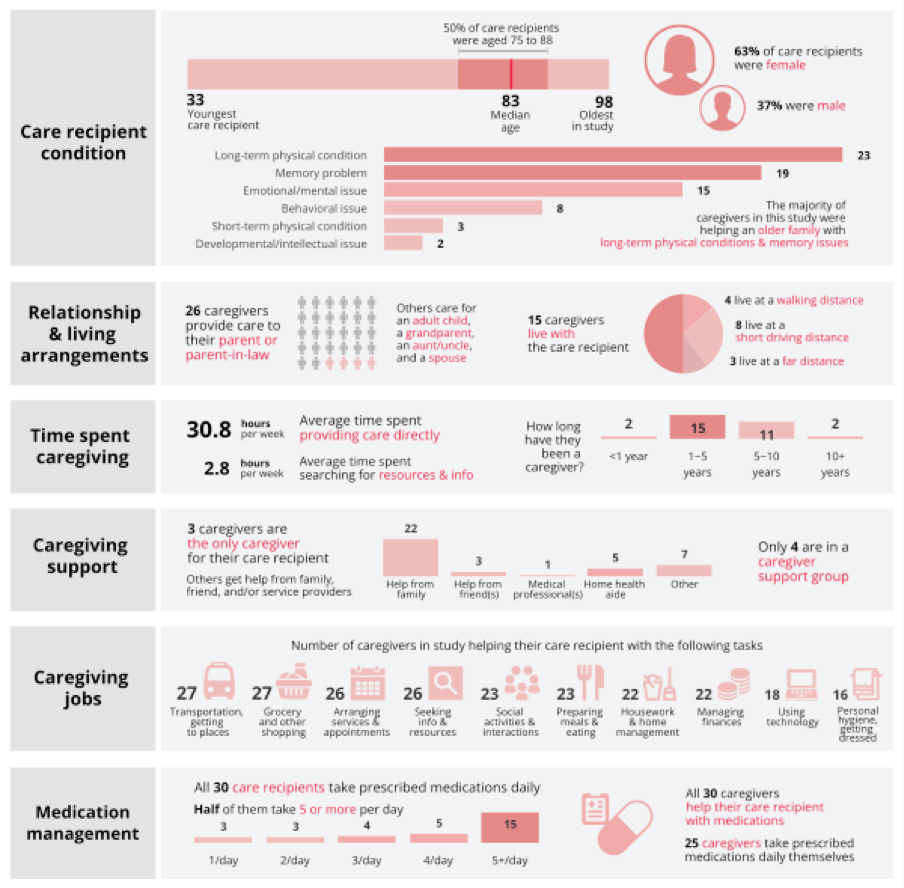
50% of care recipients were aged 75 to 88. The youngest care recipient was 33, while the oldest was 98. The median age of care recipients was 83.
63% of care recipients were female, while 37% were male.
23 caregivers in this study were helping a family member with a long-term physical condition.
19 caregivers in this study were helping a family member with a memory problem.
15 caregivers in this study were helping a family member with an emotional or mental issue.
8 caregivers in this study were helping a family member with a behavioral issue.
3 caregivers in this study were helping a family member with a short-term physical condition.
2 caregivers in this study were helping a family member with a developmental or intellectual issue.
The majority of caregivers in this study were helping an older family member with long-term physical conditions and memory problems.
Relationship and living arrangements
26 participating caregivers provide care to their parent or parent-in-law. Others care for an adult child, a grandparent, an aunt or uncle, and a spouse.
15 caregivers live with the care recipient, 4 live at a walking distance, 8 live at a short driving distance, and 3 live at a far distance.
Time spent caregiving
The average time spent providing care directly is 30.8 hours per week, while the average time spent searching for resources and information is 2.8 hours per week.
| Number of caregivers | Length of time being a caregiver |
|---|---|
| 2 | less than 1 year |
| 15 | between 1 and 5 years |
| 11 | between 5 and 10 years |
| 2 | 10 years or longer |
Caregiving support
3 caregivers are the only caregiver for their care recipient, while others get help from family, friends, and or service providers.
| Number of caregivers | Who helps them |
|---|---|
| 22 | Family member |
| 3 | Friend |
| 1 | Medical professional |
| 5 | Home health aide |
| 7 | Other |
Only 4 caregivers are in a caregiver support group.
Caregiving jobs
Caregivers in the study helped their care recipient with various tasks.
| Number of caregivers | Task |
|---|---|
| 27 | Transportation, getting to places |
| 27 | Grocery and other shopping |
| 26 | Arranging services and appointments |
| 26 | Seeking information and resources |
| 23 | Social activities and interactions |
| 23 | Preparing meals and eating |
| 22 | Housework and home management |
| 22 | Managing finances |
| 18 | Using technology |
| 16 | Personal hygiene, getting dressed |
Medication management
All 30 care recipients take prescribed medications daily, with half of them taking 5 or more medications daily.
| Number of care recipients | Medications per day |
|---|---|
| 3 | 1 |
| 3 | 2 |
| 4 | 3 |
| 5 | 4 |
| 15 | 5 or more |
All 30 caregivers help their care recipient with medications, with 25 of them also taking prescribed medications daily.
Caregiving Tasks & Responsibilities
Caregivers do a lot of different things for the loved one they provide care to. In many cases, caregiving demands include tasks and activities in a variety of different areas including health care and medication management, transportation and transferring between places, preparing meals and eating, housework and home maintenance, coordinating and arranging services, personal hygiene, managing finances, keeping company and more.
By surveying 30 caregivers everyday for about a month, we've gathered a total of 834 valid reports. These reports included details of caregiving tasks and related activities, such as how they provide care for various needs, when they do such tasks, the amount of time they spend, types of support they received, and the perceived stress and strain related to carrying out various caregiving jobs.
The rich set of data was organized into 15 interactive dashboards and statistical reports, each corresponding to a specific caregiving task.
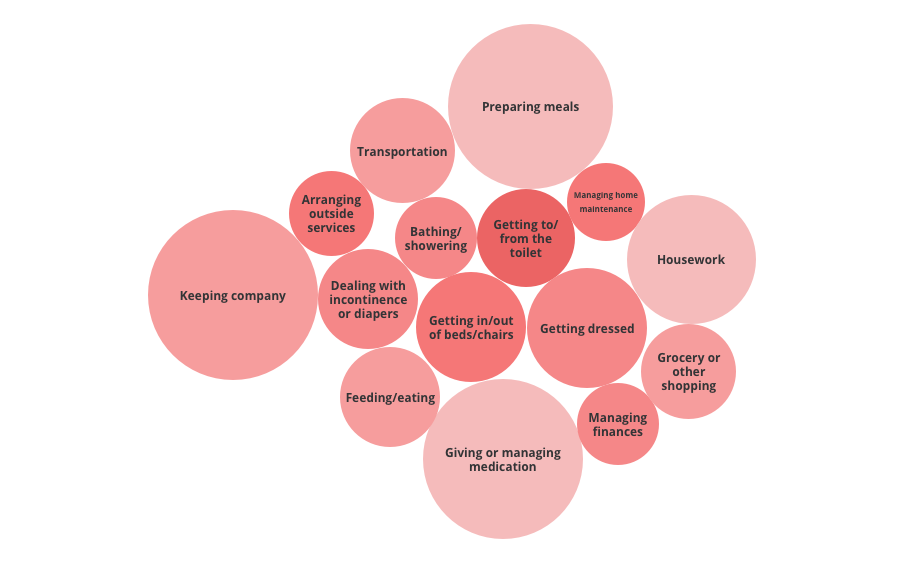
To learn more about caregiving tasks and to see how caregivers of different characteristics engage in and carry out their responsibilities, check out the bubbles!

Caregiving tasks in order of frequency mentioned, from high to low:
- Keeping company
- Preparing meals
- Giving or managing medication
- Housework
- Getting dressed
- Getting in/out of beds/chairs
- Transportation
- Feeding/eating
- Grocery or other shopping
- Dealing with incontinence or diapers
- Getting to/from the toilet
- Arranging outside services
- Bathing/showering
- Managing finances
- Managing home maintenance